
Open sourcing our video metrics
The problem
On video platforms like YouTube and Vimeo, the ability to count views is essential. This feature allows creators to adjust their content in response to viewer drop-off rates. It also serves to authenticate the quality of the content produced, effectively saying, “This must be quality content, given the high number of viewers.”
However, many creators decide to host their own content outside of traditional video platforms by simply uploading an mp4 file and incorporating a <video> tag on their website. Yet, this raises the question: How can they measure the success of their video if it’s just a video tag? It becomes challenging to determine if viewers are genuinely watching the content, or merely browsing the website. Are they experiencing delays? Are they abandoning the video within seconds due to buffering complications?
The solution
Sure, we provide our own hosted product that helps you with this and we hope to solve a lot of these problems right out of the box. But we’re not here to sell you on our product (ok, maybe a little bit). We’re here to tell you that you should take video seriously. And yes, we’re also pushing our own agenda: because we believe counting views must be done privacy-friendly fashion.
Similar how Plausible or Simple Analytics have paved the way for privacy-friendly website analytics, we have developed Mave Metrics to do the same except for video. We’re not interesting in tracking people, we want to track views. And we want to do it in a way that is easy to implement and easy to use. So let’s get technical.
Getting started
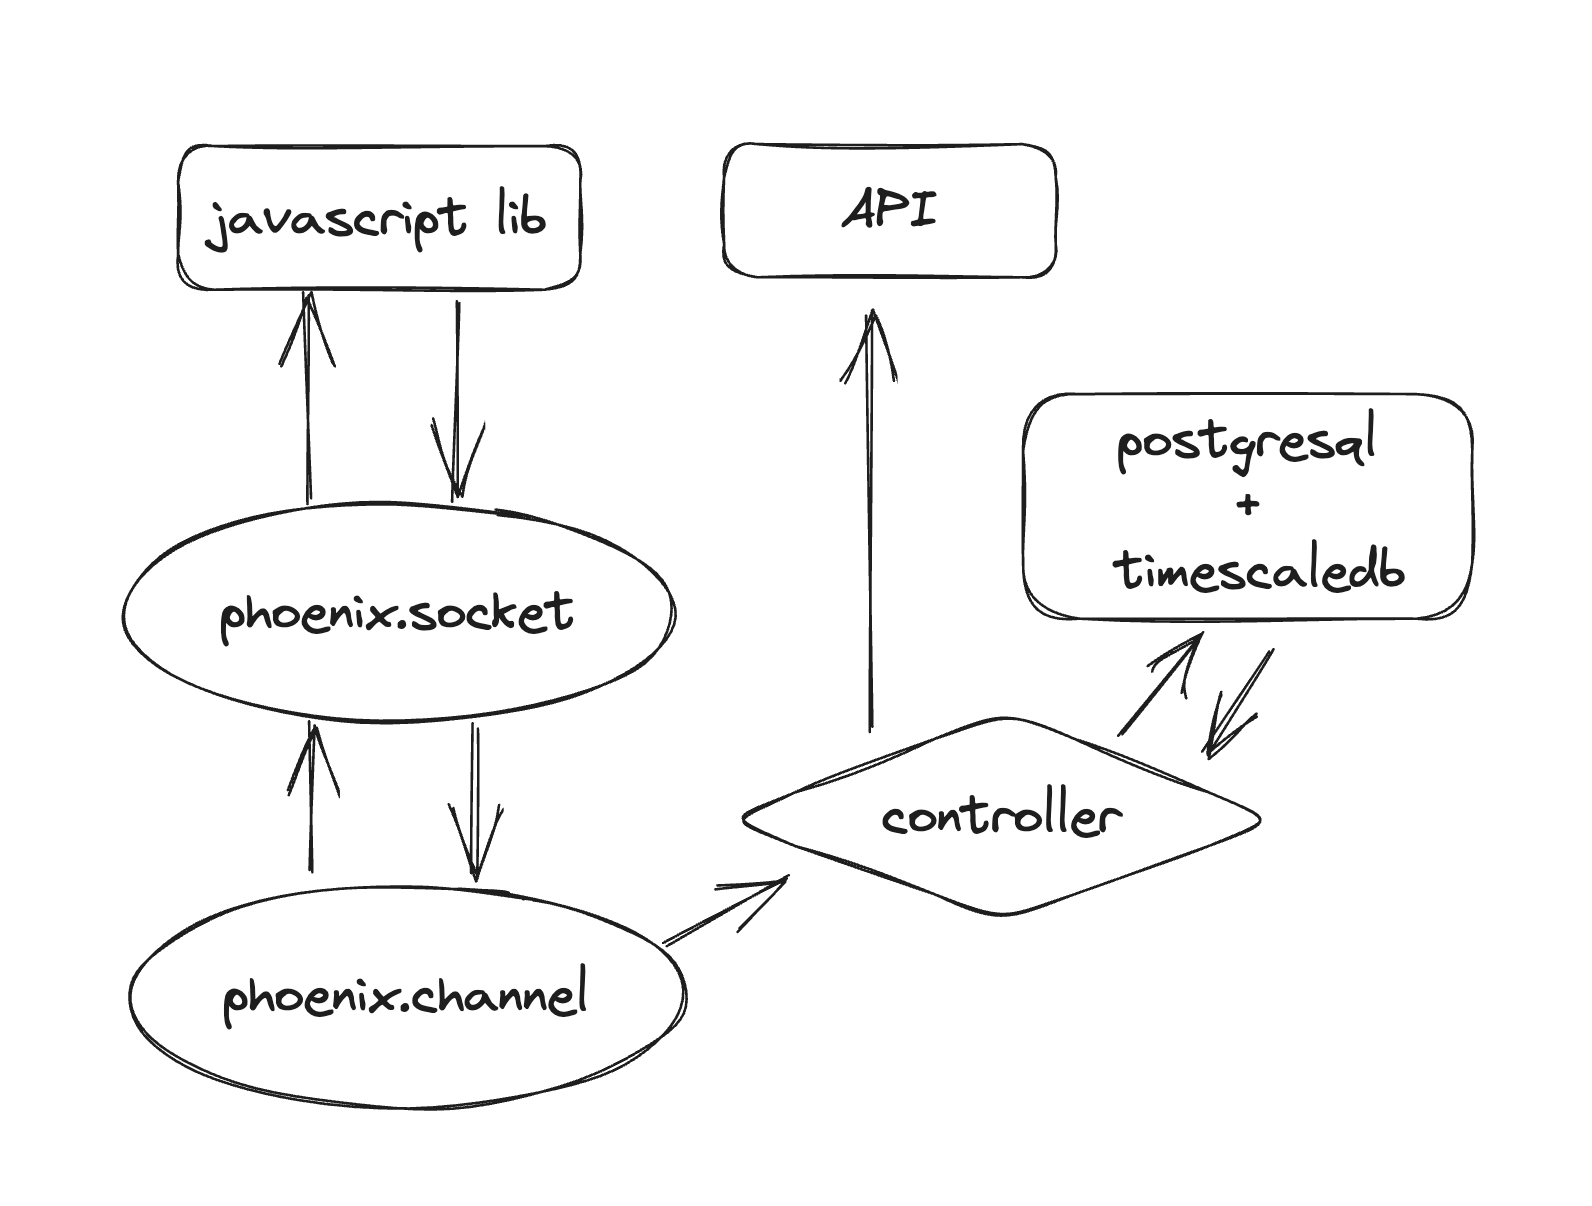
The project has a server and client library. The server is written in Elixir and is easy to run from Docker. Data is stored in PostgreSQL and it’s using TimescaleDB for time-series data, to make sure we can do nice queries. So to get started, just run:
docker compose up metricsOnce running, you can import the @maveio/metrics Javascript library in your project using NPM, and start tracking views. It’s as simple as:
npm install @maveio/metricsimport { Metrics } from "@maveio/metrics";
const video = new Metrics("#my_video", "MIB2", {
my_video_id: 1234,
});
video.monitor();The only thing it’s expecting is a <video> element with id #my_video to be present in the DOM. The second argument is an ID you can give the video metric item as reference and the third is custom metadata you can optionally send along, which you can query later. This is helpful if you want to group multiple video items together for analytical purposes.
If you’re using HLS.js you can also provide the HLS video object to the constructor. More about this can be found in the project’s readme.
Under the hood it uses Phoenix’ great implementation of sockets to gather all events from the video (in a highly scalable fashion). It doesn’t impact the video performance and it’s very lightweight.
So in conclusion: we hope it’s a really simple setup (especially if you’re familiar with Elixir), and that there’s no use for IP addresses, no cookies, no fingerprinting. Just a simple way to track video views.
The result
As of now you can get three type of metrics back. There’s no interface, just an API you can talk to. All metrics can be queried using the identifier or metadata. This means you can use either “MIB2” or the custom metadata you provided to query the data, like:
curl --location --request GET 'localhost:3000/api/v1/views' \
--data '{
    "query": {
        "video": {
            "my_video_id": 1234
        }
    },
    "timeframe": "30 days",
    "interval": "1 day"
}'
Because it’s using TimescaleDB under the hood, we can leverage the idea of time buckets. So using the API you can use an interval and timeframe. This will return the data in buckets of the given interval, for the given timeframe. For example, you can get the amount of views per day, from the last 30 days.
{
    "views": [
        {
            "browser": {
                "chrome": 73,
                "safari": 52,
                ...
            },
            "device_type": {
                "desktop": 94,
                "mobile": 43,
                ...
            },
            "interval": "2023-06-14T00:00:00.000000",
            "platform": {
                "ios": 21,
                "mac": 54,
                "windows": 11,
                ...
            },
            "total_view_time": 204.267,
            "views": 174
        },
        ...
    ]
}
Plays
Plays are recorded per session, which means they’re are unique per page view. This means if a person watches a video twice within the same session, it just counts as one. But if that person refreshes the page, and watches it again, it’ll count as two. The only thing that determines the view is the minimum_watch_seconds that is required. Meaning: if you have a video of 30 seconds, a view only counts if the minimum watch time is 5 seconds for instance.
Besides the amount of views, you’ll get information about browser, device and platform type. And you get back the total amount of seconds watched, which you can use to calculate averages or other fun stuff.
Engagement
Engagement is a bit more complex, but helpful to know which parts of your video have been watched. You can create a heatmap of what parts of the video have been viewed more than others.
It’s pretty similar as views, but instead of providing an interval as bucket, you need to specify the amount of ranges you want. This will return the amount of views per range, which you can use to see if people are dropping off at a certain point.
This way you know for instance that from second 0 until 3, you had the most amount of viewers, but than slowly people stopped watching in the seconds after that.
Sources
Sources is a bit of an odd one, but it’s helpful to know where your video is being watched. This is helpful if you’re embedding your video on multiple sites, and you want to know which one is performing best.
Why open source?
We’re developers and we make use of open source project daily. But it’s not just about giving back. Our main goal is to offer you high-quality videos that perform exceptionally well, giving you the power to create truly unique and awe-inspiring experiences. Privacy is a big deal for us, and we firmly believe that you should have complete control over your data.
By open sourcing our product, our aim is to be completely transparent and accountable. We want to show you that we’re not interested in snooping on you or your visitors. Our focus is on tracking views, as we believe it’s important for you to gauge the impact of your videos.
And if you run your own website with video on it (and not use mave.io), we’d like to give you more insight in your video to improve it and make it better (and eventually decide to switch to mave obviously).
What now
It’s an ongoing project, but we’re using it in production at mave.io. We’re also thinking on a hosted (standalone) version, so you don’t have to run it yourself.
We’re looking for developers, privacy advocates and the wider community to contribute to the project, ensuring continuous improvement and alignment with privacy principles.
So if you’re interested in contributing, please do! We’re happy to accept pull requests and help you get started. Just let us know by reaching out to us on Discord, or creating an issue on Github.
Happy coding and tracking views!
